Root access is required to access and use the Daily Process log.
If you are managing your VPS or Dedicated server with WHM, then one of the common logs that you may use to monitor performance or troubleshoot load issues is the Daily Process Log. You can view how much each CPU and memory that the processes consume. The following tutorial will walk you through the different parts of the log and tell you how to get to it.
How to log into the Daily Process Log
- Login to WHM as the root user.
-
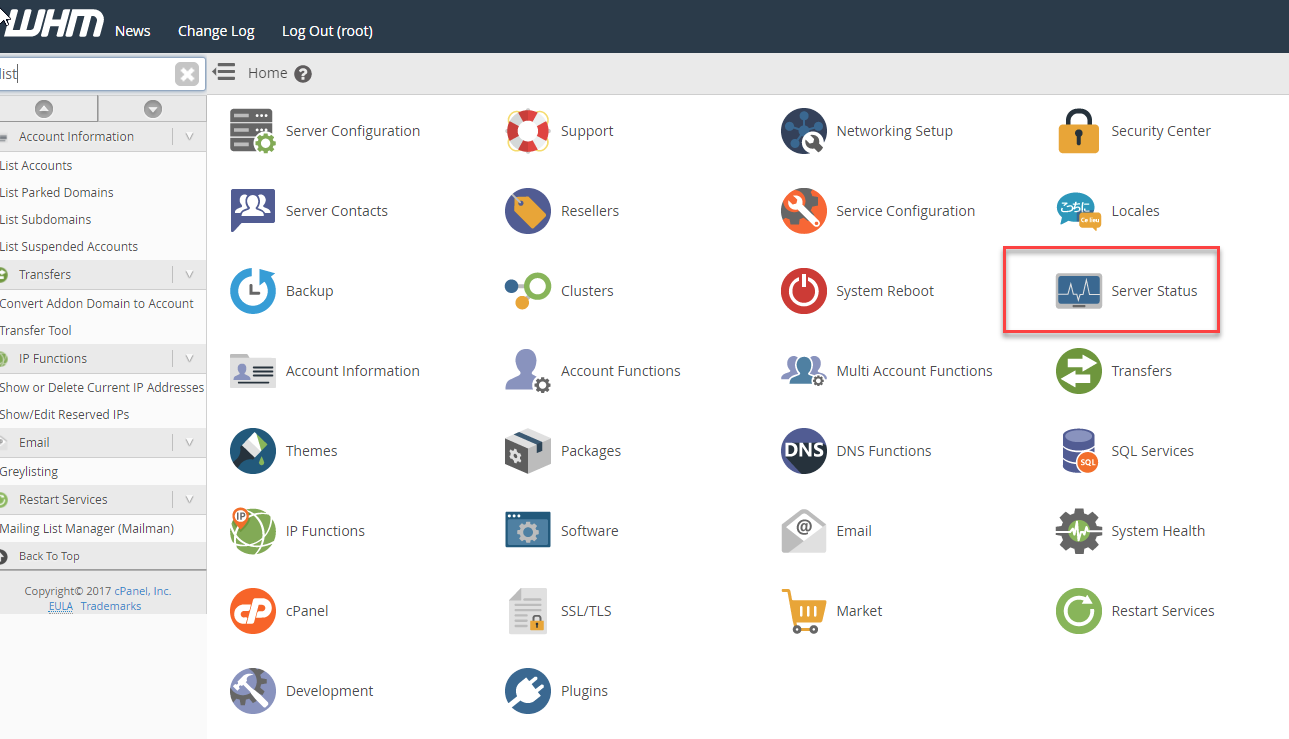
In the home screen for the WHM interface, look for and then click on the Server Status icon.
-
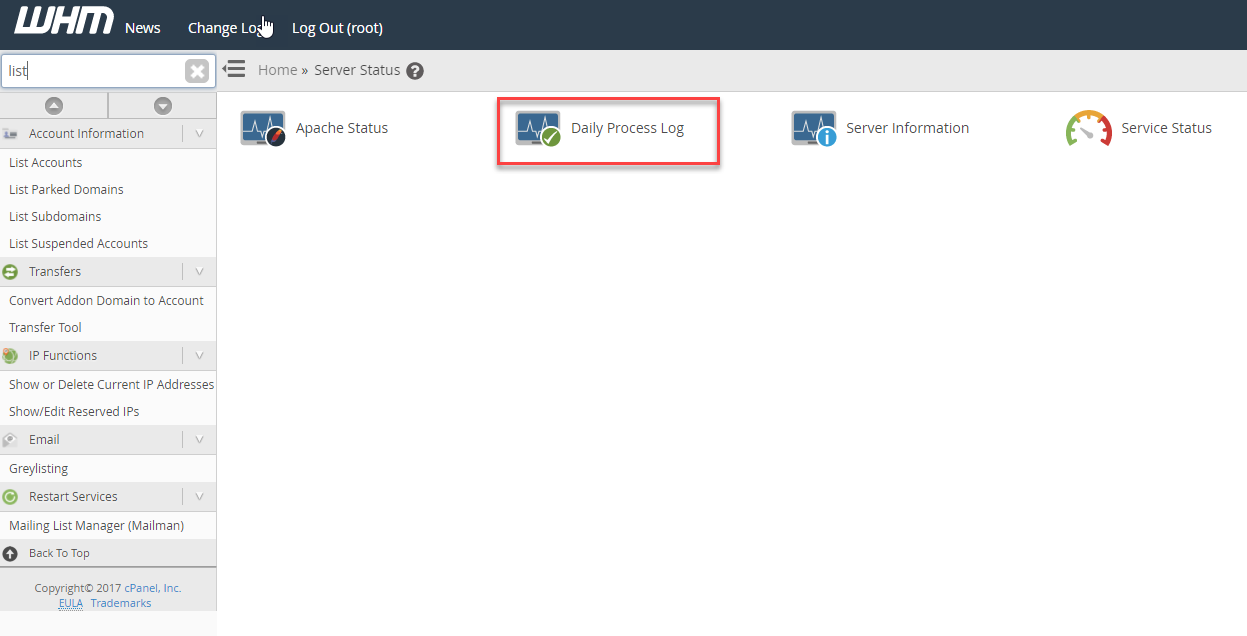
Next, click on the Daily Process Log icon. This will bring you the Daily Process Log screen.
Daily Process Log
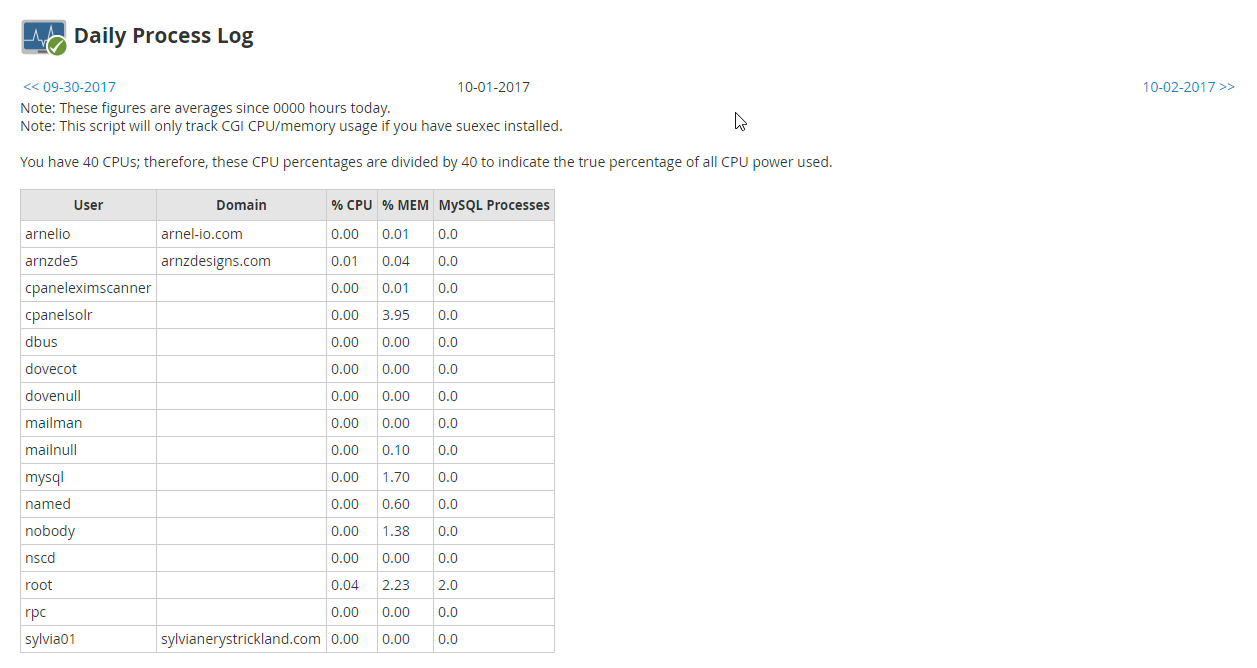
You will see the daily processes for the day. There are two tables, one is set to User and views the percentage of CPU and Memory used, and the average number of MySQL processes in use. The lower table lists the top processes mainly showing the percentage of CPU used and the actually process consuming the CPUS resource from the process list. Each of the tables can be sorted by user or domain as well as each column provided in the table.
Daily Process Log – Top Processes
If you’re already logged into the Daily Process Log, then you can skip to step 4.
How to select the the day in the Daily Process Log
- Login to WHM as the root user.
-

In the home screen for the WHM interface, look for and then click on the Server Status icon.
-

Next, click on the Daily Process Log icon. This will bring you the Daily Process Log screen.
-
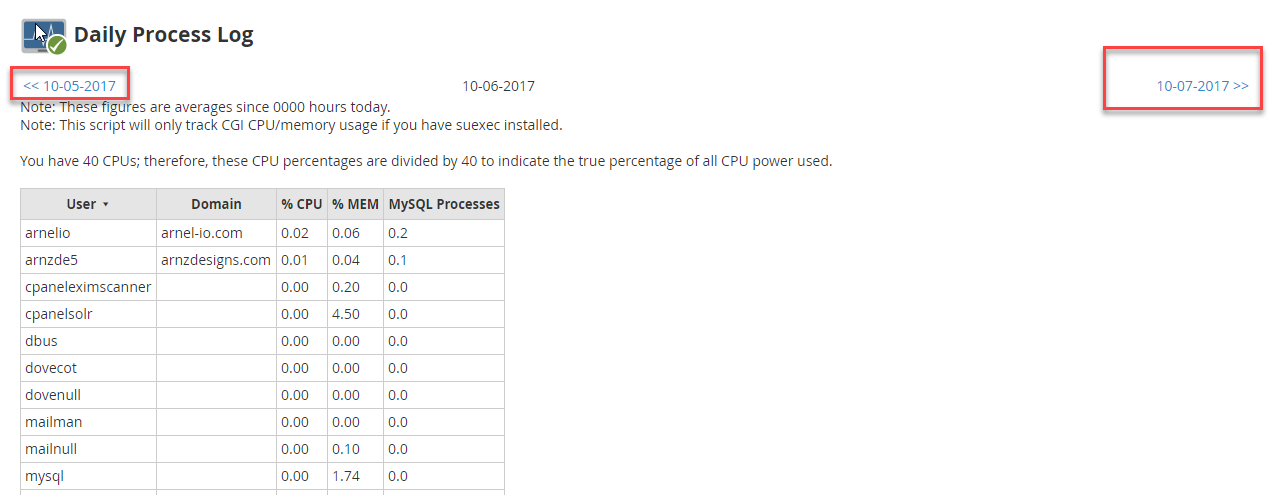
Notice that at the top of the Daily Process log page you will see the date. You can move either forward or backward in the log by clicking on the respective arrows.
For more information about the different information on finding out more about your Server statuses and processes, please see Using the Service Status to check your server in WHM.
Comments
It looks like this article doesn't have any comments yet - you can be the first. If you have any comments or questions, start the conversation!