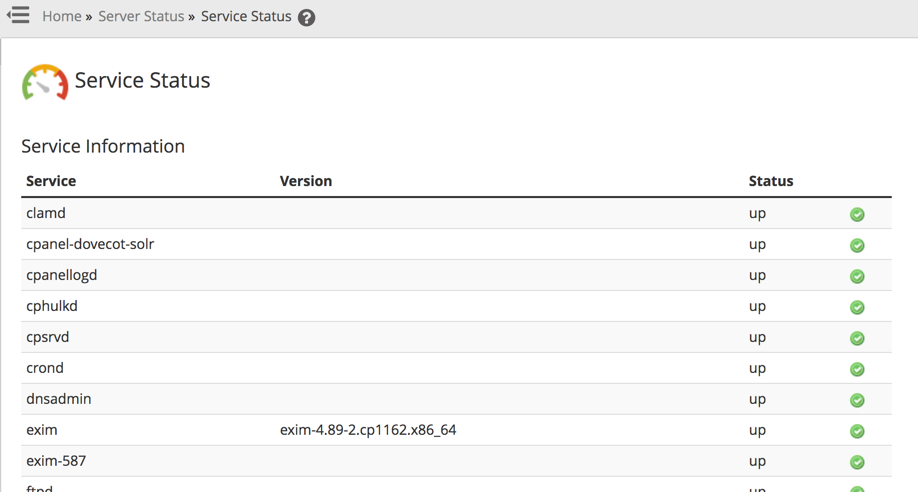
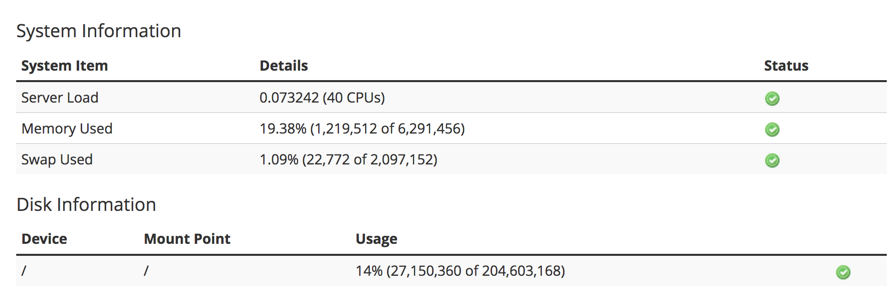
The Service Information option in the Server Status of WHM allows you to see the service status for each of the statuses currently running on your server. It provides the name of the service, version of the service and the status of that service. The Service Status screen provides System Information that includes the details and status for the Server Load, Memory Used, and Swap Used. Finally, it also provides Disk information including the device, mount point and usage of the server storage.
How to Launch the Service Status
- Login to WHM as the root user.

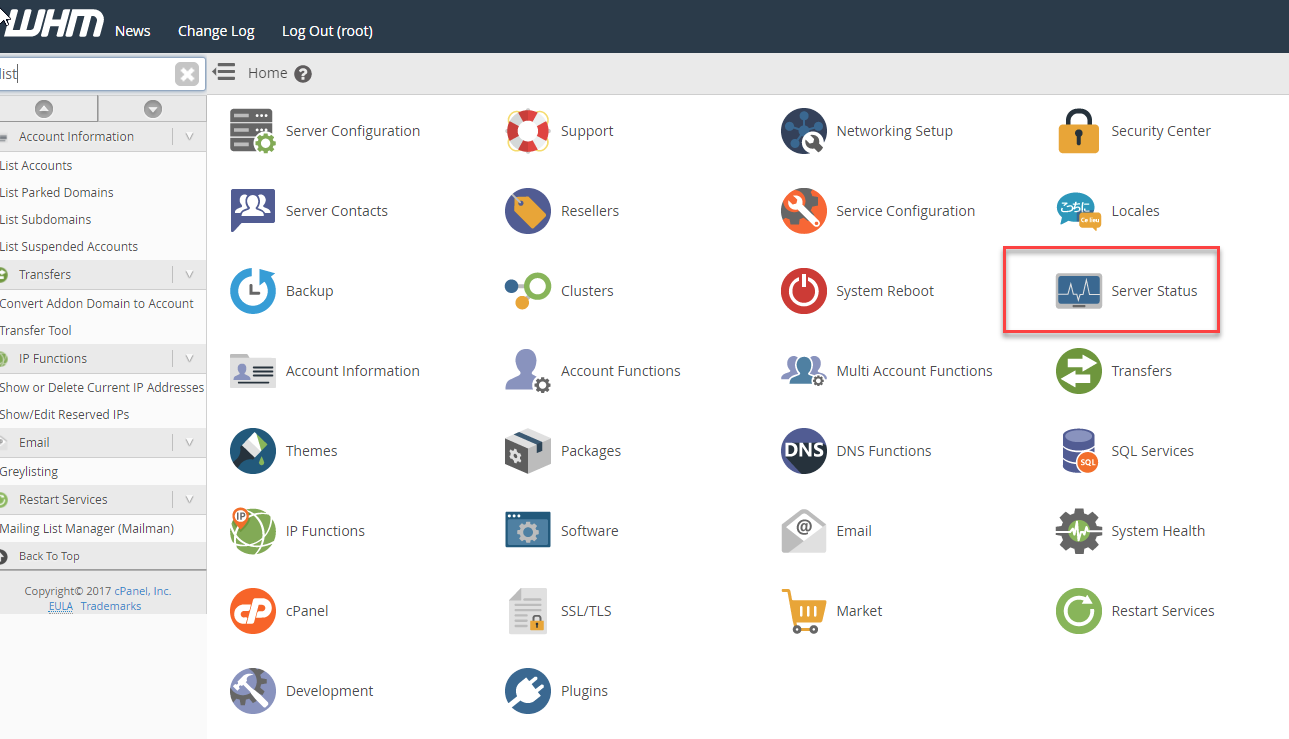
In the home screen for the WHM interface, look for and then click on the Server Status icon.

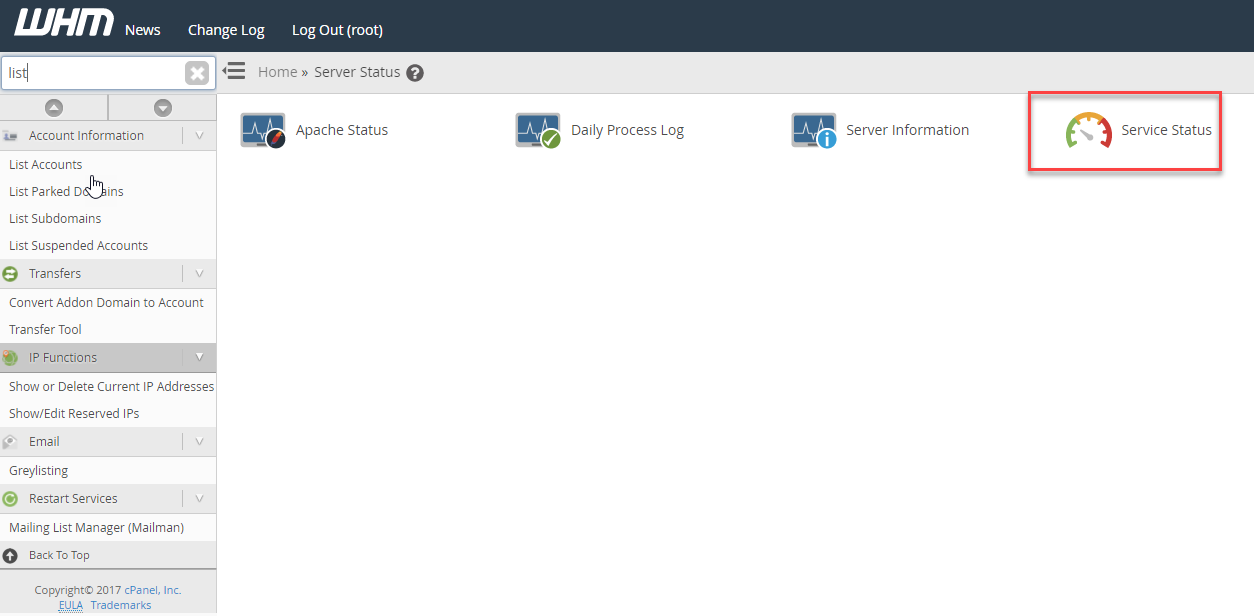
Next, click on the Service Status icon. This will bring you the Service Status screen.

Once you open the Server Status section you will see a table showing the services that currently running on the server.
If you scroll down you will then see the section showing the System and Disk information. The sections shows a status and information for the server load, the current memory used, and the current swap space used. The Disk information shows a status and information for the server’s storage devices including the mount points and current usage.
The Service Information table shows the name of the process, the version (if available), and the status of each service running on the server. A running service will have a green check mark indicating its status, while stopped services will have an exclamation point in a field of red.
InMotion Hosting servers monitor the following services by default:
- cpanellogd
- cpdavd
- cpsrvd
- crond
- exim
- httpd
- ipaliases
- mysql
- pop
- queueprocd
- rsyslogd
- spamd
- sshd
You can use the Service Manager in WHM to select the services that you wish to monitor.


Comments
It looks like this article doesn't have any comments yet - you can be the first. If you have any comments or questions, start the conversation!