When your website is live and available to viewers, you will not want to advertise any error messages that can be displayed when WordPress debugging is enabled. This can lead to security issues or disruption to your website. However, there are times when it may be necessary to enable WordPress debugging so that you can identify specific issues within your WordPress site. You can then use these errors to diagnose and resolve the problems.
WordPress debugging is both a process to identify possible website issues and also a mode that can be enabled for your WordPress site for this same purpose.
WordPress debugging can be enabled in the WordPress configuration file and also used with the new Site Health tool. In this guide, you will first learn how to verify if WordPress debugging is enabled. We will then show you how to edit the WordPress configuration file to enable the built-in debugging option.
We will also show you the commands for enabling and disabling debugging using WP-CLI. Finally, we’ll cover how to enable debugging and error logging in cPanel using the File Manager.
We recommend backing up your WordPress site before making any changes.
- Checking Site Health Tool for Debug Status
- How to Enable WordPress Debugging in WPCONFIG.PHP
- Check Debugging Status With WP-CLI
- Enable WordPress Debugging Using WP-CLI
- Enable WordPress Debugging Using File Manager
Need a new home for your WordPress site? Check out InMotion’s WordPress Hosting solutions for secure and performance-oriented servers.
Checking Site Health Tool for Debug Status
WordPress comes with the option for debugging, but it is not enabled by default. You can easily check to see if debugging has been enabled using the Site Health option in WordPress Tools. Follow the steps below to check if debugging has been enabled on your WordPress site:
- Login to the WordPress Administrator.
- Go to Tools in the WordPress main menu and then click on Site Health.
- You will then see the Site Health page. Debugging is considered a critical item by Site Health, so it will be the first item displayed if it is enabled. Here’s an example of the alert in Site Health:
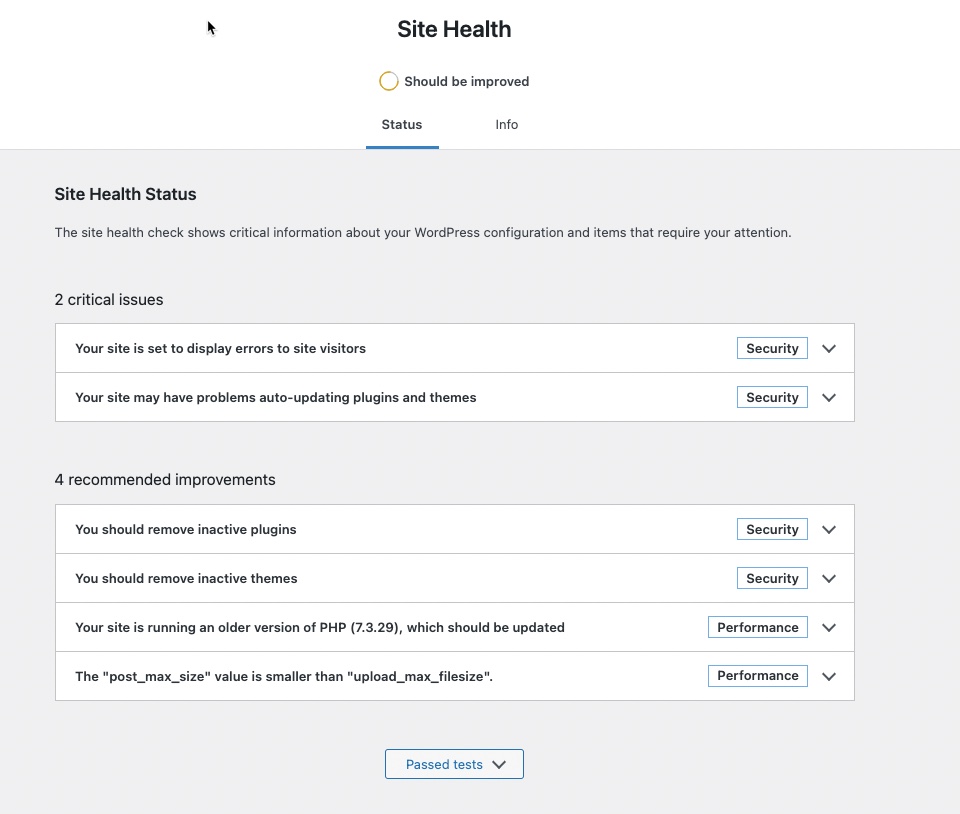
You can see that “Your site is set to display errors to site visitors.” Click on the drop-down arrow next to the Security label to see more details.
When debugging is set to display errors, this means that error messages will appear on the front end of your WordPress site when it is being viewed. Anyone seeing the error messages will automatically make assumptions about your website or believe something is wrong. So it is often recommended that the debug mode be disabled when the site is actively being used by your visitors.
Here you can see the details provided when you click on the drop-down arrow:
Note that you can see the details on how the debug mode has been enabled. They also provide the link for the direct documentation from WordPress on using their debug mode.
When debug mode is enabled, error messages will appear in the front end of your WordPress site. For example,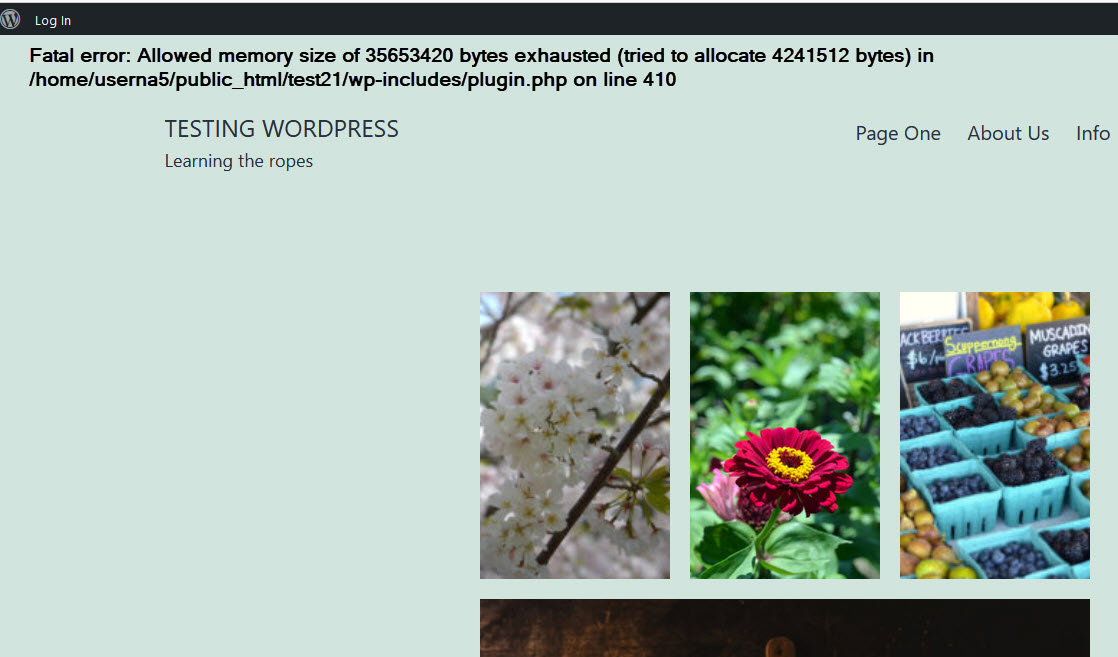
How to Enable WordPress Debugging in the wpconfig.php File
The Site Health tool gives you an overview of when the debugging mode in WordPress is enabled. You will still need to edit the wpconfig.php file in order to enable debugging. You will need to directly access your WordPress installation files in order to make the necessary file change. The wp-config.php file is a text file, so any text editor will let you edit the file once you can access it.
For this example, we are going to use the cPanel File Manager to access the wp-config.php file.
- Log in to the cPanel for your account.
- Go to Files and click on File Manager.
- Navigate to your WordPress site files. The wp-config.php file is located at the root of your WordPress installation files.
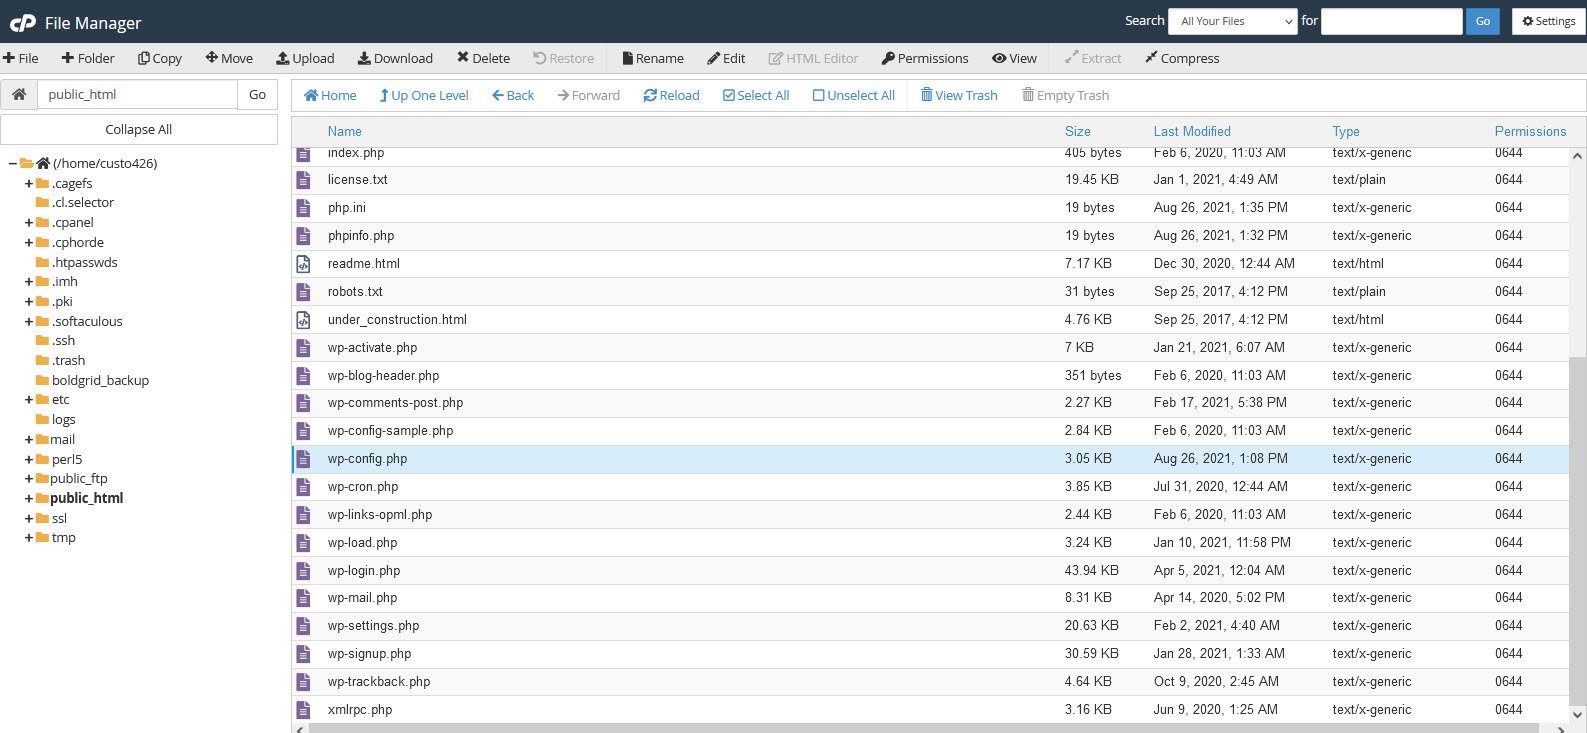
- Once you have found the file, right-click on it and select Edit. You can also left-click and use the menu at the top of the File Manager to edit the file.
- Search for this code: define(‘WP_DEBUG’, true);
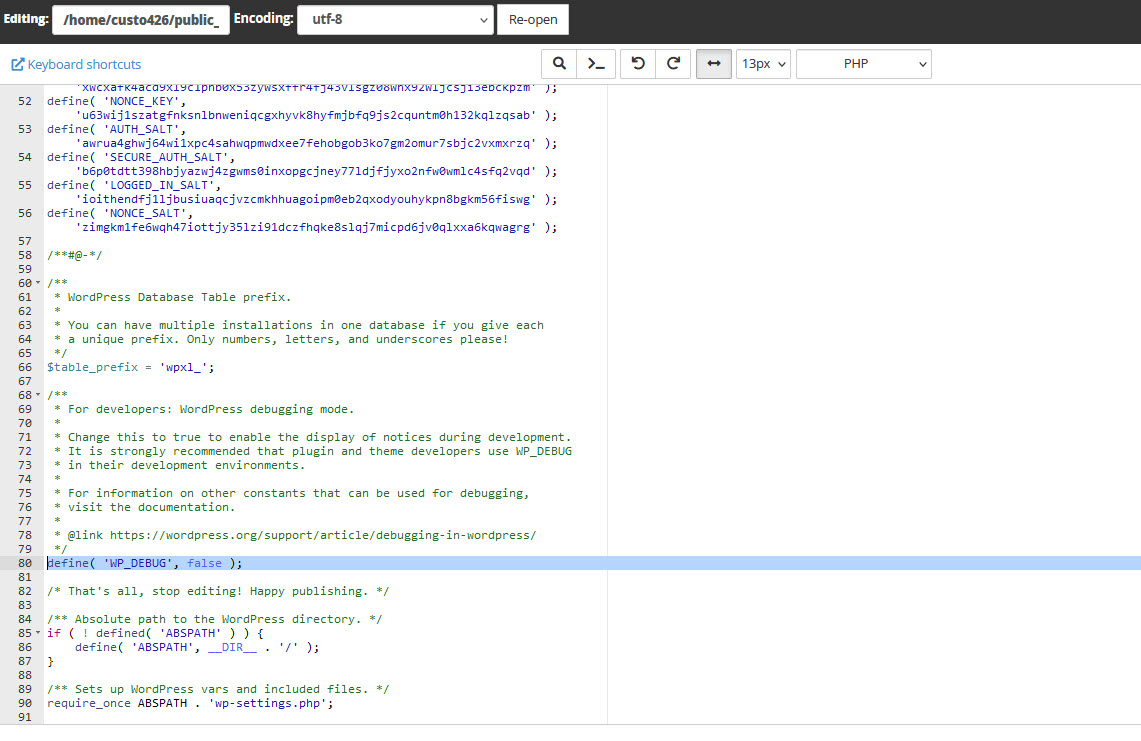
- If you don’t see the line there, then WordPress debugging will not be enabled. You can simply add the line and use “true” or “false” to enable/disable the option.
- Click on SAVE CHANGES in the top right corner once you have made any changes.
Debug Options
There are multiple options for WordPress debugging available to you by using another line of code under the “define( ‘WP_DEBUG’, true )” line. You can add a single option, several, or all of them. Here is the code for each and description of what each option provides:
WP_DEBUG_LOG
define( 'WP_DEBUG_LOG', true);This option saves errors on your WordPress site to a debug.log file. If there are multiple errors, or if they are generating errors that can’t be read on-screen, then this option will need to be activated.
You can determine the location and name of the file like this:
define( 'WP_DEBUG_LOG', '/tmp/wp-errors.log');WP_DEBUG_DISPLAY
define( 'WP_DEBUG_DISPLAY', false );This option provides the opportunity to have debugging enabled, but without the error messages appearing on the front end of the site. This option should be used with the WP_DEBUG_LOG option in order to capture the errors that may be occurring on your site. Be careful with this option as it can hide errors being displayed that would otherwise give you the information to help troubleshoot your site. This option is set to “true” by default.
SCRIPT_DEBUG
define( "SCRIPT_DEBUG", true );Script_Debugt forces your WordPress site to use the “dev” versions of the core CSS and Javascript instead of the minified versions that are normally loaded with an operating WordPress site. Normally, this option defaults to “false”, but it can help you test Javascript or CSS files that you have modified for your site.
SAVEQUERIES
define( 'SAVEQUERIES', true);If you are having issues that relate to your WordPress database, then you may want to use this version in order to view your database queries. Queries are saved in an array on your database in a table called “queries”. Caution should be taken when using this option as it can slow the performance of your site. This option should not be active when you are normally operating your website.
Once you have the debug mode on, you can review the errors that are being produced to help you troubleshoot your WordPress site.
Remember to disable the debug mode once you have completed troubleshooting your site.
Check Debugging Status With WP-CLI
You must install WP-CLI on your server before you can follow these sections.
Using the wp-config list command, you can determine if the WP_DEBUG constant is set to true (enabled) or false (disabled).
- SSH into your server as the user that will be running WP-CLI.
- Use the cd command to switch to the document root directory of your website. Example:
cd public_html
NOTE: Be sure to replace public_html with the actual path to the document root directory of your website.
- Run the following command:
wp config list WP_DEBUG
You should see an output similar to this when the command finishes running. If the value is “false” debugging is disabled, if it is “true” it is already enabled.[email protected] [~/public_html]# wp config list WP_DEBUG
+----------+-------+----------+
| name | value | type |
+----------+-------+----------+
| WP_DEBUG | false | constant |
+----------+-------+----------+
Enable Debugging With WP-CLI
You can also enable debugging by creating/modifying a new wp-config.php file using WP-CLI.
The WP-CLI command wp config allows you to generate a wp-config.php file. The generated config file includes the list variables, constants, and other required settings for running a WordPress site. In this section, you will learn how to set WP_DEBUG to true to enable debugging mode for WordPress.
- SSH into your server as the user that will be running WP-CLI.
- Use the cd command to switch to the document root directory of your website. Example:
cd public_html
NOTE: Be sure to replace public_html with the actual path to the document root directory of your website.
- Run the following command to enable WordPress Debugging:
wp config set WP_DEBUG true
An output similar to the following will be displayed once the command finishes running.[email protected] [~/public_html/wordpress]# wp config set WP_DEBUG true Success: Updated the constant 'WP_DEBUG' in the 'wp-config.php' file with the value 'true'. - Be sure to disable debugging when you are done working with your website. This helps to secure your website by hiding errors that may contain private information. The process to disable debugging is the same as outlined in the steps above, simply use false rather than true. For example:
wp config set WP_DEBUG false
Now you know how to use WP-CLI to check, enable and disable debugging for WordPress.
Learn more about WP-CLI, the command-line interface for WordPress, and streamline your WordPress maintenance workflow!
Enable WordPress Debugging Using File Manager
WordPress debugging is something that is enabled within your wp-config.php file. With just a simple edit to this file, you will be able to view any errors produced within WordPress. For more information on the WP Debug global variable, see the WordPress Codex page.
- First, be sure that you are logged into cPanel.
- Now that you are logged into cPanel, look for the icon that says File Manager and click on it.
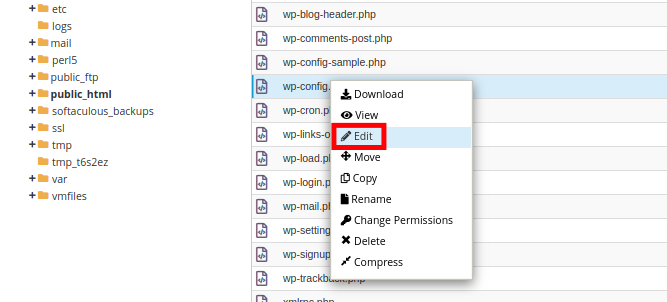
- Within your public_html directory, you will see a file labeled wp-config.php. Right-click on it, then click the Edit option.
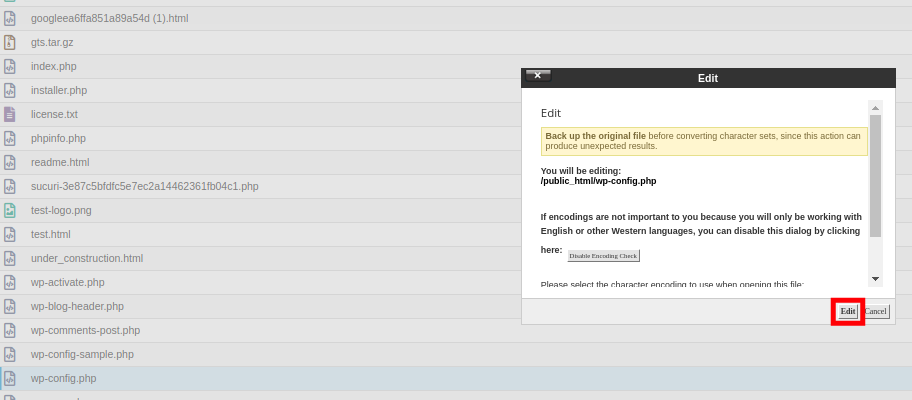
- A pop-up message will list the file you are about to modify. Click the Edit button again.
- At the bottom of your wp-config.php file, add the following lines. The first line will cause WordPress to display any errors caused by various PHP functions that are built into WordPress. The second line will display any errors for built-in JavaScript and CSS.
define( ‘WP_DEBUG’, true );
define( ‘SCRIPT_DEBUG’, true );
Note: Your wp-config.php file may already have WP_DEBUG set to false. If this is the case, you can simply replace “false” with “true”. Then add the additional lines for SCRIPT_DEBUG and WP_DEBUG_LOG below, if you want them on.
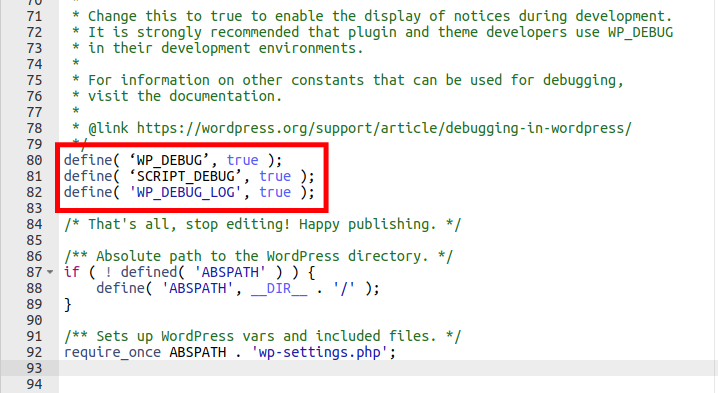
- If you want the errors to be saved to a debug.log file within the “/wp-content” folder add the following line.
define( 'WP_DEBUG_LOG', true );
- After you have edited the wp-config.php file, be sure to click the Save Changes button on the top-right of the file manager.
- Be sure to disable debugging when you are done working with your website. You can do this by commenting out the lines by putting a /* before and a */ after. For example:
/*
define( ‘WP_DEBUG’, true );
define( ‘SCRIPT_DEBUG’, true );
define( 'WP_DEBUG_LOG', true );
*/
Now that you have enabled debugging within WordPress, you should be able to see any errors that are produced within your WordPress site. Visit our WordPress Education Channel for lots of helpful guides.
Learn more tips and tricks about WordPress backups to protect your website from risks!
Check out more WordPress tutorials from the support center:
- How to Add a User Role In The Members Plugin
- Why We Use Nginx In Our WordPress Hosting
- How to Backup WordPress to Dropbox
- How to Backup WordPress over Email
- Optimize WordPress Guide: Tuning for VPS & Dedicated Servers
- Easy WordPress “Hardening” in the Htaccess File
- How to Create and Delete a WordPress Page Using WP-CLI
- How to Restore a Previous Version of a Page or Post
- How to Backup WordPress with FTP
Comments
It looks like this article doesn't have any comments yet - you can be the first. If you have any comments or questions, start the conversation!